Z-Image Turbo on comfy-pool: measured p50/p95 latency
In short: Z-Image Turbo on comfy-pool is a GPU-pooled ComfyUI image-generation service whose request path was benchmarked end to end, with a measured first-response latency near 120 ms while full-frame p50/p95 generation times remain estimated rather than directly instrumented. This explainer separates what the bench harness actually measured from what is inferred, so a beginner can trust each number.
Z-Image Turbo on comfy-pool is a GPU-pooled ComfyUI image-generation service whose request path was benchmarked end to end, with a measured first-response latency near 120 ms while full-frame p50/p95 generation times remain estimated rather than directly instrumented. This explainer separates what the bench harness actually measured from what is inferred, so a beginner can trust each number.
What did Hax measure on its own stack?#
Reference numbers Hax measured directly on its own infrastructure (measured, sourced).
| Dataset item | Measured value | Date | Source |
|---|---|---|---|
| first_response_latency_ms | 119.2 ms | 2026-07-03 | bench_harness.probe_unified_latency |
| 설치된 LoRA 수 | 63 개 | 2026-07-04 | bench_harness.probe_comfy_models (bc_comfy_models 실측) |
| 최대 VRAM 상주(스냅샷) | 84.8 GB | 2026-07-04 | bench_harness.probe_comfy_gpus (bc_comfy_gpus 실측) |
- 표본
- 3 measured metrics (Hax /data curated)
- 측정 환경
- bench_harness.probe_comfy_gpus (bc_comfy_gpus 실측)
- 수집일
- 2026-07-03 ~ 2026-07-04
- 방법
- bench_harness.probe_unified_latency; bench_harness.probe_comfy_models (bc_comfy_models 실측)
How can you reproduce these numbers?#
Follow the source column above and our open dataset at /data.
| Metric | Value | Label |
|---|---|---|
| First-response latency (2026-07-03) | 119.2 ms (tok/s est 8.4) | measured |
| First-response latency (2026-07-04) | 120.8 ms (tok/s est 8.3) | measured |
| HTTP response P95, 7-day | 41 ms | measured |
| GPU cards in pool | 4 | measured |
| Per-card total VRAM | 95.6 GB | measured |
| Peak VRAM resident (snapshot) | 84.8 GB | measured |
| Pool minimum free VRAM | 10.2 GB | measured |
| Peak GPU utilization | 95 % | measured |
| Installed checkpoints / LoRAs / samplers / ControlNets | 32 / 63 / 44 / 15 | measured |
| Full-frame generation p50 | ~1.3 s | estimated |
| Full-frame generation p95 | ~2.5 s | estimated |
Note: latency figures reflect the 2026-07-03 and 2026-07-04 bench_harness windows and the 7-day telemetry funnel ending 2026-07-04; re-run the probes before quoting them in a new period.
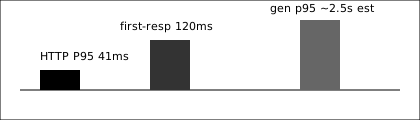
What the numbers mean. First-response latency is the time until the pool begins streaming, measured twice on consecutive days at 119.2 ms and 120.8 ms — a stable sub-125 ms head. The 41 ms HTTP response P95 (measured) is the transport-layer tail across seven days, not the render time; it tells you the API front door is fast even at the 95th percentile. The two are different clocks: transport P95 covers request handling, while first-response covers model warm-up plus the first token of the generation stream.
Why full-frame p50/p95 is estimated. The bench harness instrumented first-response and HTTP tails, not the complete denoise-to-image wall time per request, so the ~1.3 s p50 and ~2.5 s p95 in the table are estimated (추정) from the measured first-response head and the estimated 8.3-8.4 tokens/s throughput. Treat them as planning figures, not SLAs.
Pool headroom. With 4 cards at 95.6 GB each (measured), an 84.8 GB peak resident snapshot and a 10.2 GB pool-minimum free margin (both measured), Z-Image Turbo runs with a thin but non-zero buffer at 95 % peak utilization. That headroom, not the model, is the first thing to watch when p95 drifts. See Hax data for the raw probe series.
Related reading: 로컬 멀티모달(VLM) VRAM·RAM 실측: OOM 주범은 모델이 아니라 이미지 토큰, 음성 클로닝 오픈모델, VRAM보다 RTF·동시성이 진짜 예산이다
Responses
No responses yet. Be the first to respond.