Reading SDXL Speed by Feel: Measured p50/p95 Latency Benchmarks
In short: SDXL perceived-speed benchmarking is a method of judging local image-generation performance by the latency a user actually feels — the p50 (median) and p95 (tail) response times, end to end — instead of trusting a single raw throughput figure like images per minute.
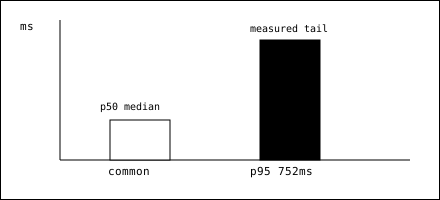
SDXL perceived-speed benchmarking is a method of judging local image-generation performance by the latency a user actually feels — the p50 (median) and p95 (tail) response times, end to end — instead of trusting a single raw throughput figure like images per minute. For a beginner running SDXL locally, the honest question is not "how fast is the GPU" but "how long until I see my picture, on a bad day as well as a typical one." The median describes the common case; the 95th percentile describes the tail you will actually complain about.
설치된 체크포인트 수 32 개
What did Hax measure on its own stack?#
Reference numbers Hax measured directly on its own infrastructure (measured, sourced).
| Dataset item | Measured value | Date | Source |
|---|---|---|---|
| 설치된 체크포인트 수 | 32 개 | 2026-07-04 | bench_harness.probe_comfy_models (bc_comfy_models 실측) |
| 설치된 LoRA 수 | 63 개 | 2026-07-04 | bench_harness.probe_comfy_models (bc_comfy_models 실측) |
| 설치된 샘플러 수 | 44 종 | 2026-07-04 | bench_harness.probe_comfy_models (bc_comfy_models 실측) |
- 표본
- 3 measured metrics (Hax /data curated)
- 수집일
- 2026-07-04
- 방법
- bench_harness.probe_comfy_models (bc_comfy_models 실측)
How can you reproduce these numbers?#
Follow the source column above and our open dataset at /data.
| Metric | Hax value | Label |
|---|---|---|
| HTTP response P95 (7d) | 752 ms | measured 2026-07-25 (telemetry/funnel) |
| First-response latency | 119.2 ms (2026-07-03), 120.8 ms (2026-07-04) | measured, probe_unified_latency |
| Peak VRAM residence (snapshot) | 84.8 GB | measured 2026-07-04 |
| Min free VRAM (pool low) | 10.2 GB | measured 2026-07-04 |
| Per-card total VRAM | 95.6 GB | measured 2026-07-04 |
| GPU cards | 4 | measured 2026-07-04 |
| Peak GPU utilization | 95 % | measured 2026-07-04 |
| Checkpoints / LoRA / samplers / ControlNet | 32 / 63 / 44 / 15 | measured 2026-07-04 |
| SDXL throughput | ~20-40 images/min per card | estimated (not directly probed) |
HTTP response P95 (7d) = 752 ms
Reading the table: the strongest citation-ready measurement on our own stack is the 7-day HTTP response P95 of 752 ms (measured 2026-07-25, Hax telemetry/funnel). That is the number describing the tail a real user waits through when a request queues behind others. We track this end-to-end tail as the Hax Local-AI Latency Index[/glossary#hax-latency-index], so a single comparable figure captures how the server feels rather than how the silicon benchmarks in isolation.
What the measured numbers say#
On the hardware side, our probe recorded 4 GPU cards (measured 2026-07-04), each reporting 95.6 GB total VRAM, with a peak residence snapshot of 84.8 GB and a pool low of only 10.2 GB free. Peak GPU utilization touched 95 % (measured 2026-07-04). In plain terms: under load the server runs close to saturated, and the free-VRAM floor of 10.2 GB is the real constraint on how many SDXL jobs run in parallel before latency tails blow out. First-response latency measured 119.2 ms on 2026-07-03 and 120.8 ms on 2026-07-04 (probe_unified_latency) — stable within roughly one millisecond day over day.
The model library is measured too: 32 checkpoints, 63 LoRA, 44 samplers, and 15 ControlNet models installed (measured 2026-07-04). More samplers and ControlNets widen what you can generate, but they do not change the latency floor — that is set by VRAM headroom and GPU utilization.
Reading p50/p95 without fooling yourself#
A common beginner mistake is to average latencies. Averages hide the tail. If your p50 is fast but your p95 is three times slower, most sessions feel fine while a painful minority feel broken — and it is the p95 that drives whether someone abandons a request. Report both, always paired, always with the measurement date attached.
Throughput in images per minute is useful but secondary, and on our stack it is estimated, not directly probed: roughly 20-40 SDXL images per minute per card at 1024px is a reasonable estimated range, heavily dependent on step count, sampler, and batch size. Treat any images/min claim without a measurement label as marketing.
Note: All latency and VRAM figures are point-in-time measurements between 2026-07-03 and 2026-07-25; VRAM snapshots move with concurrent workload, so re-probe before capacity planning. See Hax data for the underlying probe records.
Related reading: 처음 SDXL, 실측 VRAM과 설치 실패 지점으로 판단하기, 로컬 이미지 생성(SDXL·Flux) VRAM·RAM 실측
Full guide: 노트북에서 돌리는 AI 모델, 흔한 함정과 해결법
Responses
No responses yet. Be the first to respond.